Recording equipment
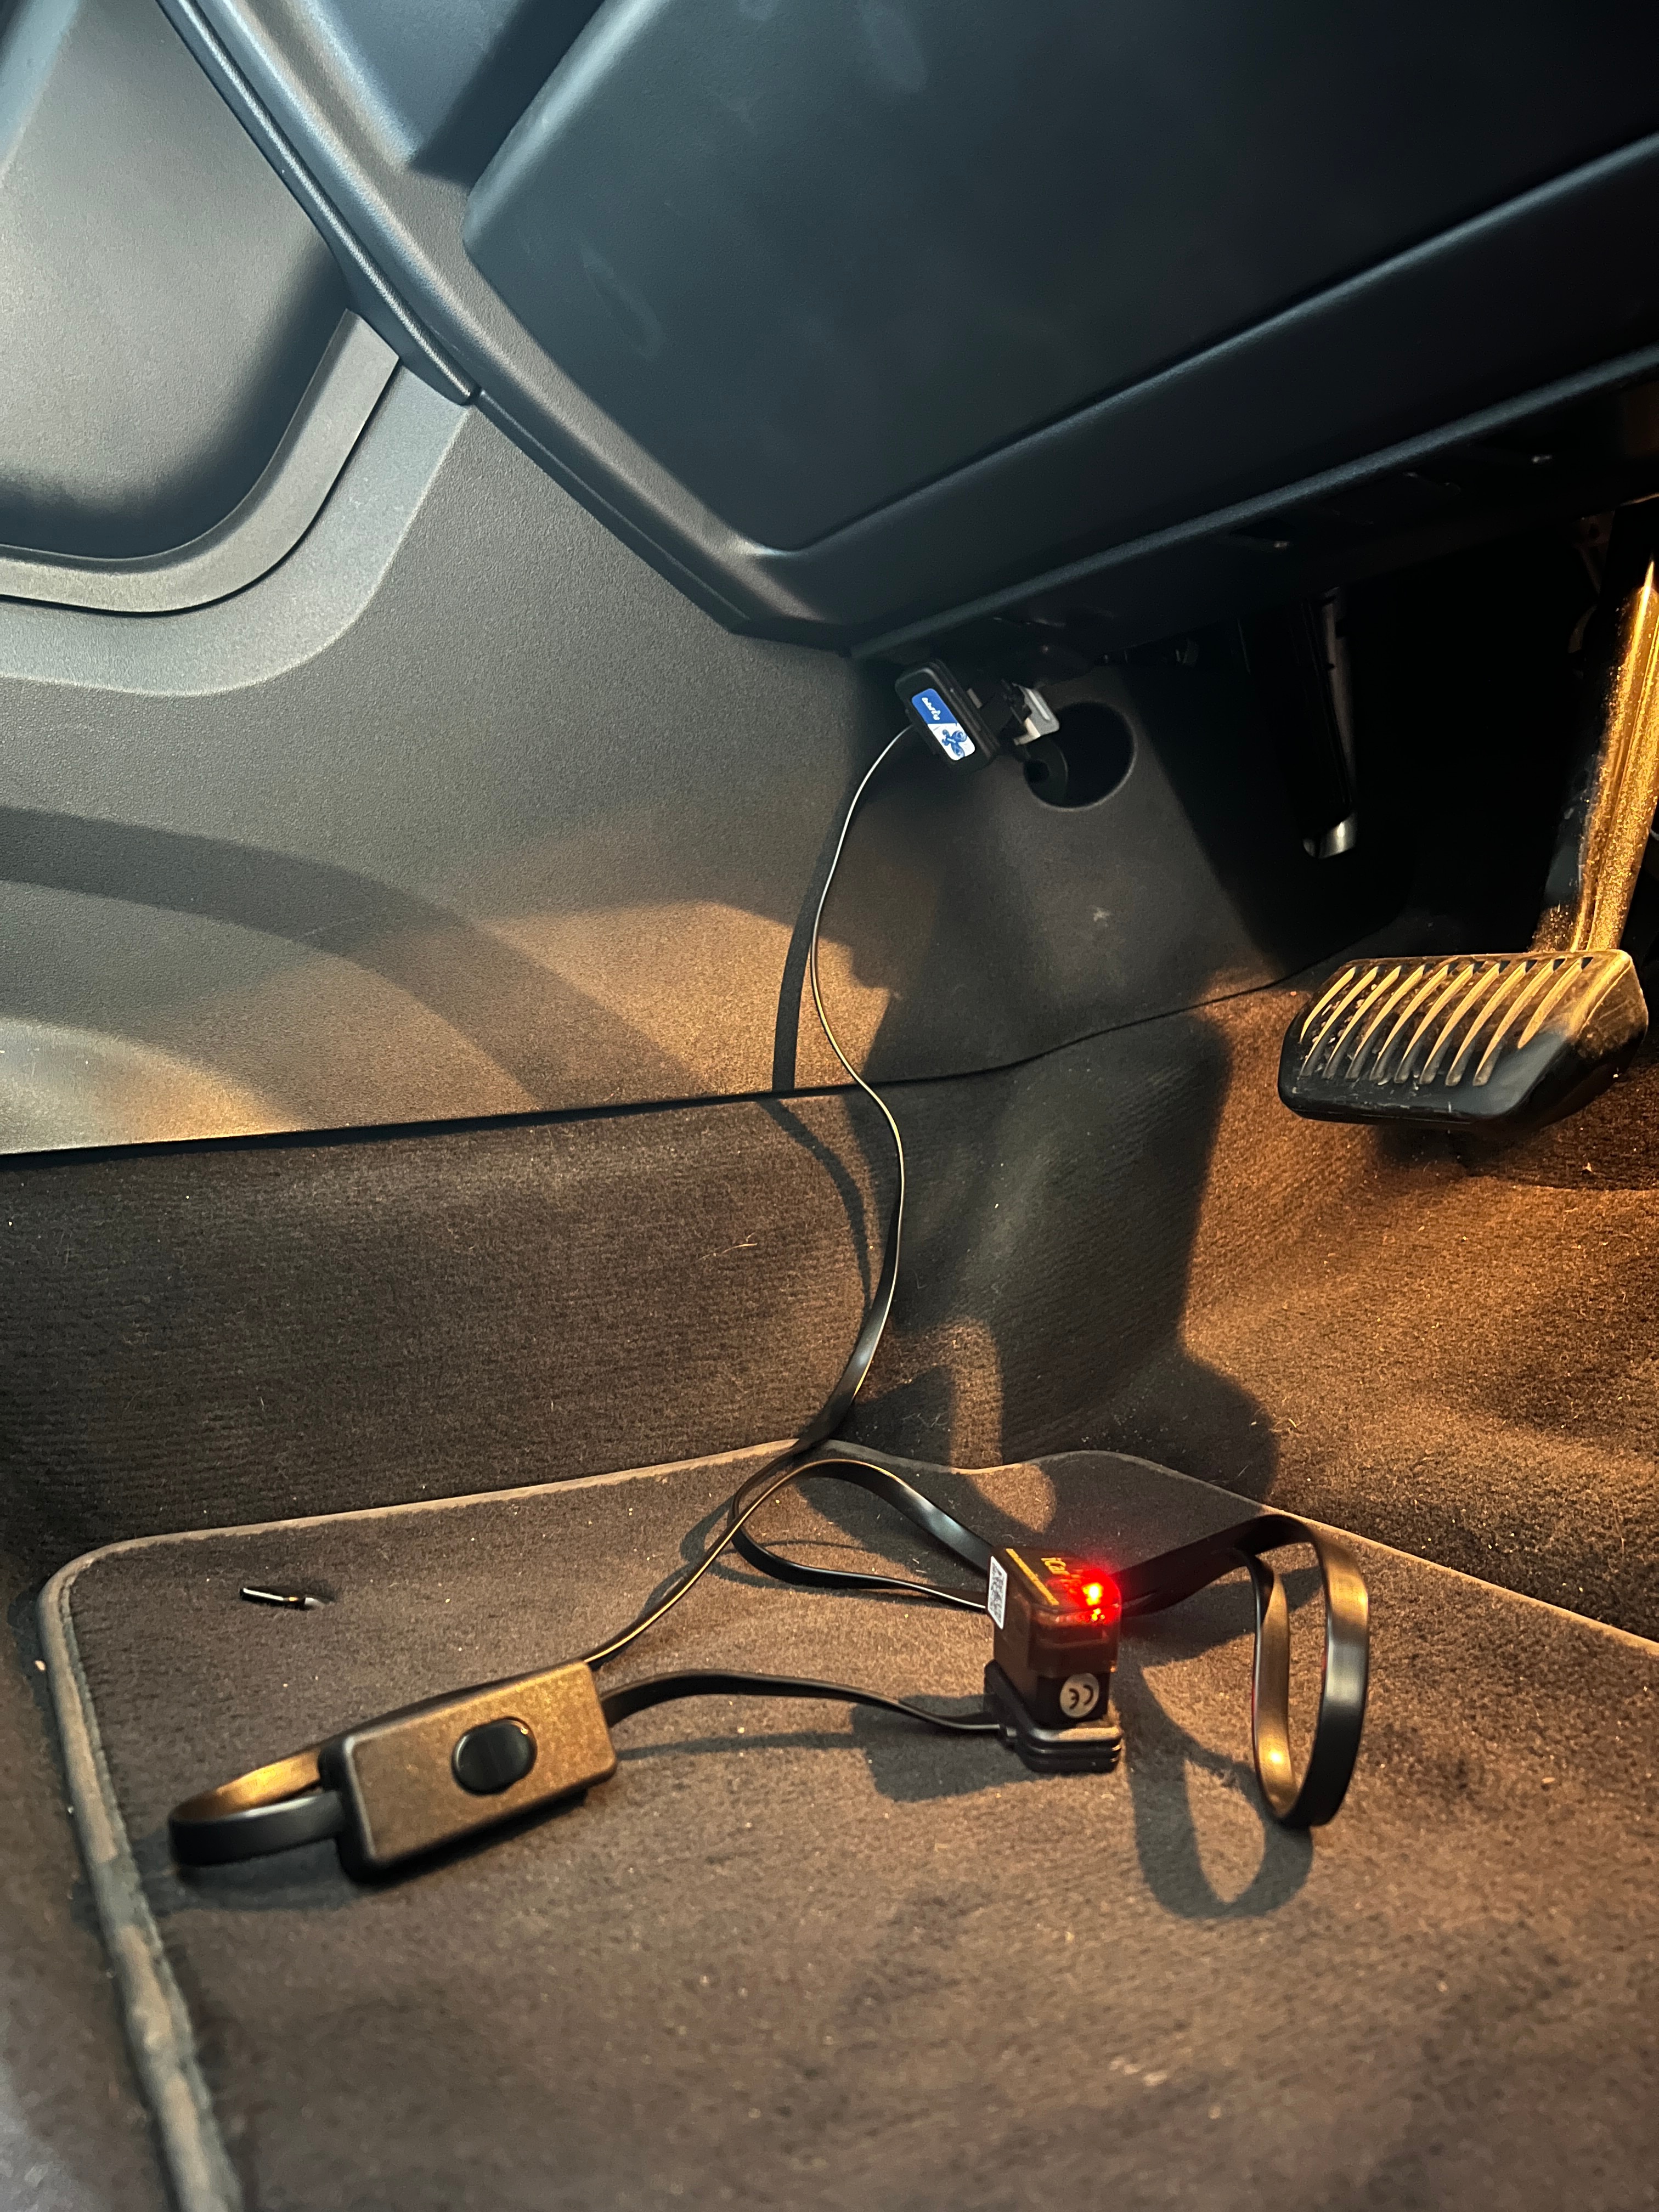
OBD2 scanner
Every car manufactured after 1996 has an OBD2 port, which is used to connect an OBD2 scanner to the car's computer system. The OBD2 scanner can read data from the system, such as engine RPM, vehicle speed, fuel consumption, DPF soot level, and much more.
For this project, I used a ~£20 scanner from Amazon called Vgate iCar Pro Bluetooth 4.0 (BLE) OBD2 Fault Code Reader [#ad], which I connected to my car's OBD2 port.
Note that iOS devices only work with Bluetooth 4.0/BLE (Bluetooth Low Energy) OBD2 scanners, hence my choice for the Vgate iCar Pro. If you have an Android device, you may be able to use a non-BLE OBD2 scanner. The Vgate iCar Pro works with both iOS and Android devices (although myself I have only tested it with an iPhone).
OBD2 extension cable (optional)
I also purchased an OBD2 extension cable with a switch to turn off the scanner when not in use. This is useful to prevent the scanner from draining the car's battery when the adapter is left plugged in for a long time (days) without the engine running.
I used this product from Amazon: bbflyOBD A6 OBD II OBD2 Splitter Extension 16 Pin Extension Cable Adapter [#ad]
If you plan on plugging/unplugging the scanner frequently, I recommend getting this cable. It not only protects the car's battery, but also the car's OBD2 port from wear and tear.

iOS app
Once I had the hardware, I had to find an iOS application that supported the Vgate iCar Pro and also was capable of recording DPF related data from the car.
After a bit of trial and error, I have settled on using "Car Scanner ELM OBD2". It works for both iOS and Android devices, and it has a free version that should be sufficient for most users.
- App's website: https://www.carscanner.info
- iOS app: https://apps.apple.com/gb/app/car-scanner-elm-obd2/id1259933623
- Android app: https://play.google.com/store/apps/details?id=com.ovz.carscanner
After installing the application on my phone, I paired it with the Vgate iCar Pro OBD2 scanner via Bluetooth LE:
and configured the following connection profile matching my car's engine:
After connecting to the car, Car Scanner allows you to create your own dashboards. I created a dashboard that uses the following sensors:
- Top left: Exhaust Gas Temperature Bank 1, Sensor 3 [ºC]. According to information found on Land Rover forums, this sensor is used by the ECU to measure the temperature of the exhaust gases entering the DPF.
- Top right: DPF regeneration status. This sensor tells you if the DPF is currently doing a passive regeneration (value 1), an active regeneration (value 2), or if it is not regenerating at all (value 0). I have also configured a rule for the sensor to have a red background if a regeneration is in progress (value 1 or 2), so that I can easily see when the DPF is regenerating. On the screenshot above you can see how an active regeneration looks like.
- Bottom right: DPF Soot Mass [g]. This sensor tells you how much soot is accumulated in the DPF. In my experience if this value goes above 30g, the DPF will perform an active regeneration to burn off the soot. Once an active regeneration is complete, this value usually drops back to under 10g.
Once the necessary sensors were added to the dashboard, I opened the dashboard's settings (by clicking on the "Customize page" button), and I enabled the "Update in background" feature, which allows the app to record data in the background even when the app is not running in the foreground.
Finally, I enabled the data recording feature in the app, and started recording my trips.
It is worth highlighting that I purchased the Pro version of the app because I found it provided a lot of value. However, I believe the free version should be sufficient for most users.
Please note, that as an Amazon Associate I earn from qualifying purchases.
On this page I share links to products I have purchased and used in this project. I am not advertising anything that I have not used myself.
If you buy a product from Amazon through one of these links, I may receive a small commission at no extra cost to you. This helps me keep this website running.
Thank you for your support!
Next, let's look at how to interpret the data presented on the charts.